Click here for Know Your Rights Resources
District Information
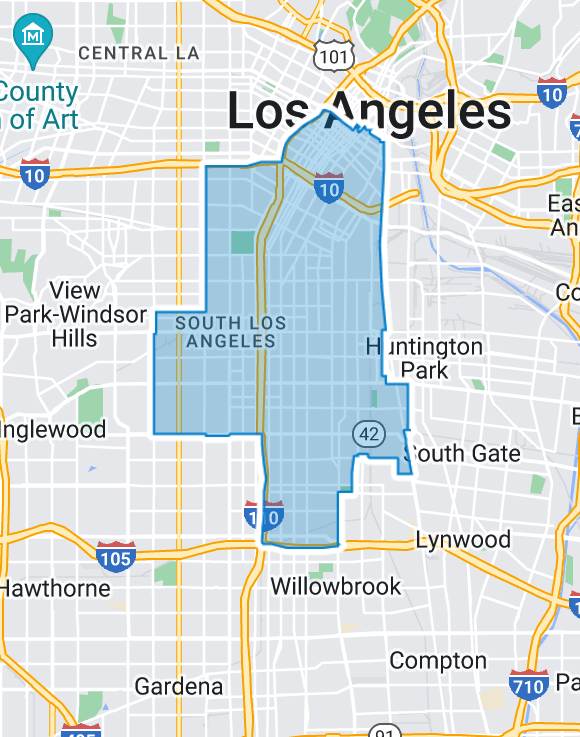
DISTRICT AD57
2020 Census Population (adj Elec. §21003)
| Name | Count | Percent |
|---|
| Total Population (POP) | 507,191 | 100.00% |
|---|
| POP Hispanic or Latino | 360,880 | 71.15% |
|---|
| POP Not Hispanic or Latino (NH) | 146,311 | 28.85% |
|---|
| POP NH Population of one race | 137,763 | 27.16% |
|---|
| POP NH White alone | 26,949 | 5.31% |
|---|
| POP NH Black or African American alone | 86,165 | 16.99% |
|---|
| POP NH Asian alone | 20,040 | 3.95% |
|---|
| POP NH American Indian and Alaska Native alone | 953 | 0.19% |
|---|
| POP NH Native Hawaiian and Other Pacific Islander alone | 430 | 0.08% |
|---|
| POP NH Some Other Race alone | 3,226 | 0.64% |
|---|
| POP NH Population of two or more races | 8,548 | 1.69% |
|---|
2020 Census Housing Occupancy Status
| Name | Count | Percent |
|---|
| Total Housing Units | 151,383 | 100.00% |
|---|
| Occupied | 141,387 | 93.40% |
|---|
| Vacant | 9,996 | 6.60% |
|---|
2020 Census Group Quarters Population (adj Elec. §21003)
| Name | Count | Percent |
|---|
| Total Group Quarters Population: | 23,128 | 100.00% |
|---|
| Institutionalized population: | 703 | 3.04% |
|---|
| Correctional facilities for adults | 93 | 0.40% |
|---|
| Juvenile facilities | 142 | 0.61% |
|---|
| Nursing facilities/Skilled-nursing facilities | 461 | 1.99% |
|---|
| Other institutional facilities | 7 | 0.03% |
|---|
| Noninstitutionalized population: | 22,425 | 96.96% |
|---|
| College/University student housing | 7,757 | 33.54% |
|---|
| Military quarters | 0 | 0.00% |
|---|
| Other noninstitutional facilities | 14,668 | 63.42% |
|---|
Counties In District
| Name | Count | Percent |
|---|
| Los Angeles | 507,189 | 5.05% |
|---|
Places In District
| Name | Count | Percent |
|---|
| LOS ANGELES: Florence-Graham(U) | 62,456 | 100.00% |
|---|
| LOS ANGELES: Los Angeles(C) | 444,733 | 11.37% |
|---|
